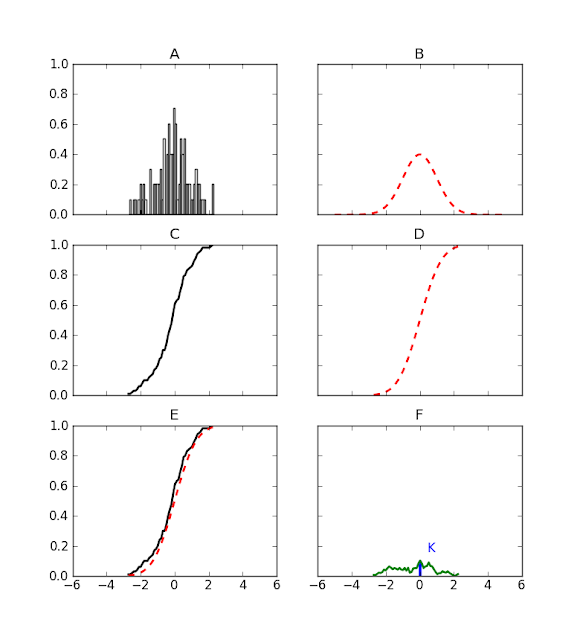
Today's problem is to determine if a sample of N numbers (Fig.A) is compatible with a given probability distribution (Fig.B). Instead of the probability distribution functions we will consider the two cumulative probability distributions (Fig.C and D). The Kolmogorov-Smirnov statistics, K, is the maximum distance from zero of the difference between the two cumulative distribution functions (Fig.E and F). In the ideal limit of infinite data points, the analytic expression for the probability distribtion of K is known and in the next post we will compute the p-value for the initial sample.
Useful Wikipedia links for further reading are:
Kolmogorov-Smirnov test
Donkster's theorem
Brownian bridge
This is the code I used to generate the figures:
import matplotlib.pyplot as plt
import numpy as np
from scipy.stats import norm
from scipy.stats import cumfreq
mean, sigma, nvariates = 0, 1, 100
np.random.seed(2)
sample = norm.rvs(mean, sigma, size=nvariates)
fig, axs = plt.subplots(nrows=3, ncols=2, sharex=True, sharey=True)
# Fig.A
ax = axs[0, 0]
ax.hist(sample, 50, normed=1, facecolor='white')
ax.set_title('A')
# Fig.B
ax = axs[0, 1]
x = np.arange(-5, 5, 0.001)
ax.plot(x, norm.pdf(x, mean, sigma), 'r--', linewidth=2)
ax.set_title('B')
# Fig.C
ax = axs[1, 0]
partialsums, xmin, xstep, extrapoints = cumfreq(sample, 50)
x = np.arange(xmin, xmin+50*xstep, xstep)
partialfractions = partialsums/nvariates
ax.plot(x, partialfractions, 'k', linewidth=2)
ax.set_title('C')
# Fig.D
ax = axs[1, 1]
ax.plot(x, norm.cdf(x, mean, sigma), 'r--', linewidth=2)
ax.set_title('D')
# Fig.E
ax = axs[2, 0]
ax.plot(x, partialfractions, 'k', linewidth=2)
ax.plot(x, norm.cdf(x, mean, sigma), 'r--', linewidth=2)
ax.set_title('E')
# Fig.F
ax = axs[2, 1]
differences = abs(partialfractions - norm.cdf(x, mean, sigma))
ax.plot(x, differences, color='g', linewidth=2)
xline = xmin+xstep*np.argmax(differences)
yline = np.amax(differences)
ax.vlines(xline, ymin=0, ymax=yline, color='b', linewidth=3)
ax.text(xline+0.5, 1.5*yline, 'K', color='b')
ax.set_title('F')
plt.show()
Addendum: the code above can be improved


Situs Slot Play | Best NetEnt Casinos
ReplyDeleteBest Online Casinos in the world ✓ NetEnt Casinos ✓ Top 메리트카지노 NetEnt Live Dealer Games. Play fun88 soikeotot Now! 카지노사이트 Sign up for an account.